Building out a criminal network using entity extraction over a large number of unstructured documents.
 As mentioned in our introductory post [LINK], one of our primary use cases at Quantifind is determining how “exposed” a bank is to a certain risk. Often, investigators at a bank are focused on a “seed” of interest: an individual, a crime ring, or even a broad theme. For example, when a terrorist attack happens, the bank wants to know (quickly): Did we help facilitate any of the perpetrators’ transactions? Or, when a Department of Justice cracks down on a particular ponzi-scheme, the bank wants to know: Are any of the suspected organizations, or their victims, represented in our internal data?
Of course it is critical how to measure exposure, i.e., the overlap between some external watchlist and internal data. Criminal networks can be expansive, and checking only a few principal participants, or looking at internal data alone, will not be sufficient. To address this, Quantifind has developed an automated approach to “blow out” the graph of connections, to dynamically produce a large set of “related entities,” by extracting and inferring a network of connections from public data. This generalized form of social network analysis (not to be confused with the analysis of social network sites) allows us to expand our watchlist to the next level and, subsequently, screen customers in the outer rings of this network to ensure that the bank is clear of exposure—not only at first-order, but second-order and beyond.
This blog post demonstrates an example of this use case for the Department of Justice indictment of a crime ring centered on “Phantom Secure,” a technology company allegedly used to encrypt drug trafficking communications.
Example: PHANTOM SECURE
“Canada-based Phantom Secure was a criminal enterprise that provided secure communications to high-level drug traffickers and other criminal organization leaders.”
– Department of Justice Press Release, 3/15/2018
Money launderers and other criminals will always take advantage of new technologies to stay a step ahead of law enforcement. Certain bands of criminals are “early adopters” of technology and will adopt new methods before the authorities have a chance to catch up. A recent Department of Justice (DOJ) press release highlights the case of “Phantom Secure,” a Canadian provider of supposedly secure communications technology. While there are many legitimate corporate attempts at providing encrypted infrastructure for non-illegal use cases, the DOJ alleged that Phantom Secure and its associates catered directly towards illicit use cases, such as developing communication systems for drug trafficking networks, spanning the globe, from Australia to Canada to multiple South American countries.
Our goal in this specific case is to create a dynamic watch-list by expanding the entity graph around Phantom Secure while using only public sources. The five individuals mentioned in the press-release are only the tip of the iceberg and we want to bring in all other relevant associates. This process requires only that a user input the initial seed, “Phantom Secure” in this case. The system then extracts all “related entities” from news articles and potentially many other open source documents, and returns them in a graph data-structure that details the connections and the data behind each connection (e.g., news co-mention URL’s). This data-structure can then be used to “link back” to internal data, using entity-resolution techniques to assess bank exposure.
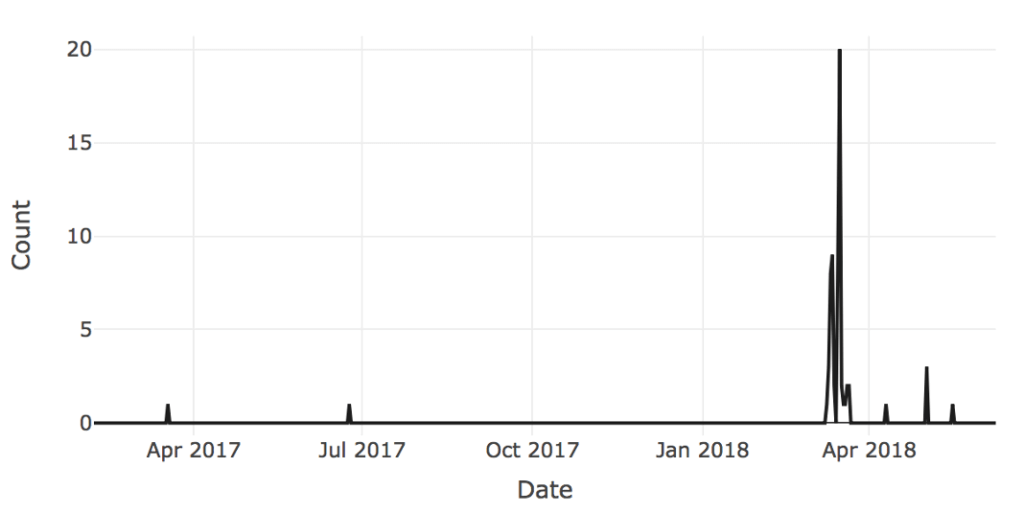
The time series below shows the volume of documents over time related to Phantom Secure and gives a sense of the activity in question. Although the peak of the activity occurs in March of 2018 at the time of the DOJ press release, there exist articles both before and after that add to the story and provide information on other key players.

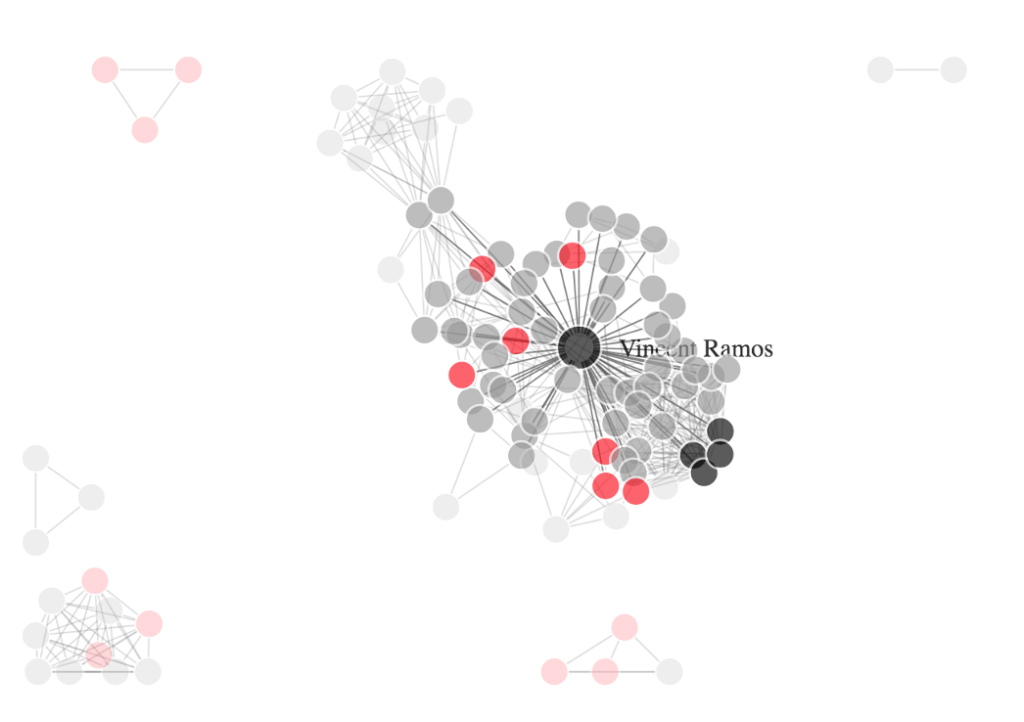
From these articles, we can automatically extract a graph of connections. The data visualization below demonstrates how individuals in the Phantom Secure sphere of influence are connected based on document co-occurrence.

Black nodes represent the “principal” participants from the original DOJ press release. Red nodes are suspected criminal individuals found via expanding the set to related articles. This is the primary piece of value because official documents often omit a much larger ring of players who are involved. (Note that there are isolated “sub-rings”, disconnected from most of the data, that contain suspect individuals but do not connect to the principal actors in the principal cluster.) The remaining gray nodes are all other connected entities (often journalists, law enforcement, and other “good guys”). The labels for most nodes are redacted in this graph but available in a data extract upon request.
The ultimate statistics for this example are given in this table.

Ultimately, we have expanded the list of “bad actors” by almost an order of magnitude, from 5 to 46. By screening internal data over this significantly larger watchlist, any bank could be extra confident that they were properly assessing their risk of being exposed to individuals in this criminal network.
DIFFERENTIATING METHODOLOGY
There are many challenges involved in executing this process effectively. This is not an exhaustive list, but the challenges are roughly as follows:
- Ingesting large swaths of relevant news and other sources of content.
- Extracting entities (people and organizations) from unstructured text with precision using Named Entity Recognition (NER).
- Scoring the relationships between entities as they occur in the text. Instead of using co-occurrence alone, more advanced Natural Language
- Processing (NLP) methods can improve efficiency by down-weighting non-important relationships.
- Identifying whether or not an entity is a good guy (prosecutor, law enforcement), bad guy (belonging in the subsequent watchlist), or simply a bystander. Professional titles and other common contextual patterns make this classification automatable.
- Linking an entity to internal entities with explainable confidence using Named Entity Linking (NEL).
All of these problems are amenable to machine learning methodology, and hence to automated improvements. When done well and at scale, the efficiency savings compared to a strictly manual process are massive. By surfacing more possible bad actors and ranking risk factors, trained models have the potential to make investigators both more effective and more efficient.
One could contrast this process (dynamically generated lists) with methods that simply cross-list against structured watchlists from various sources: e.g., the FBI’s Most Wanted List, the Southern Poverty Law Center’s (SPLC) list of hate groups, the Panama Papers, and many others (all of which we integrate into our internal systems as data sources). In the end, these approaches are complementary, and the unstructured version complements the static lists by being dynamic, full of rich context, quickly filtered, and, critically, up-to-date.
Any financial institution that is serious about reducing their risk exposure to the constant influx of criminal networks and trends should consider using this methodology to proactively screen their subjects and customers. The alternative is that either the criminal networks continue to operate undetected, or that regulators and law enforcement discover that the institution is being used first, forcing the institution into a reactive, crisis-management position.
If you are interested in learning more, please contact us.

